Every channel you use
Email, Slack, Discord, generic webhook, PagerDuty, ntfy and SMS (BYO Twilio). Route by severity or by monitor tag.
Duck Stats is built on one honest idea: a monitor is a probe plus an assertion, run on a schedule. For services we can reach: probes run from our external fleet. For boxes behind NAT: your host pushes UP/DOWN to us. No agents, no sidecars, no magic. Here's exactly what runs, where it runs, and what you get back.
Each monitor names a target and a pass condition. Pull-based probes (HTTP, TCP, DNS, SSL, ping, DB) hit you from our fleet. Push-based probes (cron, process) let your box ping us — perfect for things behind NAT.
| HTTP/S | Status code, body keyword, header, latency, redirect chain |
| TCP | Port reachability — Postgres, Redis, SMTP, game servers |
| PING | ICMP reachability and round-trip time |
| SSL | Certificate expiry & chain — warned 14 days out |
| DNS | Resolve a record and assert the answer |
| PUSH | Cron heartbeats — your job POSTs when it finishes |
| PROC | Process watcher — pgrep on your host pushes UP/DOWN |
| DB | MySQL, Postgres, Mongo, Redis — alive or full health-inspector |
| MORE | gRPC, Kafka, RabbitMQ, JSON-query, Docker container state |
| DNSBL | Daily IP blacklist check across 10+ DNSBLs — email alert on new listings |
The fastest way to get ignored is to cry wolf. Before Duck Stats marks anything down, it re-probes from independent regions and requires agreement. A single flaky network hop between us and you won't wake you at 3am. Available on Pro and Team across our five probe locations: US East, US Central, US West, Canada East and Europe.
An average hides your worst customer's experience. Duck Stats records every probe and rolls it into p50 / p95 / p99 by the minute, so a slow tail shows up as a rising line — long before it becomes a support ticket.
One outage should be one notification — to the right place, with enough context to act before you've opened a laptop.
Email, Slack, Discord, generic webhook, PagerDuty, ntfy and SMS (BYO Twilio). Route by severity or by monitor tag.
Email alerts ship as a rich, branded HTML template by default. Flip the per-channel toggle if your inbox prefers bare text.
Open a maintenance window from the UI or POST /maintenance in your CI so a deploy never pages the on-call.
No acknowledgement in N minutes? Escalate to the next channel. Recovery sends an all-clear automatically.
Team plan ships a rich-embed status board for your Discord channel — updated every 90 seconds with per-monitor custom emoji.
Send via our managed SMTP at no extra cost, or wire in your own provider. Bring-your-own Twilio for SMS.
Enable per-monitor to have Duck Stats resolve the target every day at 04:00 and query 10+ DNSBLs (Spamhaus ZEN, Barracuda, SORBS, SpamCop, DroneBL, PSBL, Manitu, Interserver, CBL/Abuseat). If your IP hits a blocklist you get an email — no channel setup needed. Included with all plans.
For services we can't reach from the public internet — home labs, internal apps, anything behind NAT — use a push monitor. Your box POSTs UP/DOWN to a unique URL on your interval. The Process Monitor variant is a tiny pgrep script you drop on the host: it pushes UP while the process exists, DOWN when it doesn't.
MySQL monitors have an optional DB Health Inspector mode. Each tick runs a multi-query diagnostic sweep — SHOW GLOBAL STATUS, SHOW PROCESSLIST, SHOW SLAVE STATUS, top slow queries from performance_schema — and surfaces connection count, buffer-pool hit rate, replication lag and slow-query digests on the detail page. Postgres, MongoDB, Redis, SQL Server, MQTT, RabbitMQ and Kafka all have their own monitor types for connectivity and health — the deep multi-query inspector sweep above is MySQL-only today.
A clean, fast page at status.yourdomain.com with uptime history bars, live incident updates and an email subscribe box. CNAME it, theme it, done. Pro: 5 pages. Team: unlimited and full white-label.
See a live example →A REST API for every monitor, raw heartbeats for 7 days, rolled-up daily uptime and latency kept long-term, CSV export, and Prometheus-compatible metrics so Duck Stats plugs into dashboards you already run.
One-click fullscreen Wall view — every monitor as a live tile, a probe-network radar, region latency and a streaming event log. Cast it to the office TV and the room knows the second anything turns amber. Share a read-only public link for stakeholders.
If you run a hosting company on WHMCS, drop in our addon and every server you sell appears in the admin panel with live up/down status. Assign monitors to specific products — clients on the “London VPS” product see the London VPS status, clients on “Dallas dedi” see Dallas. Auto-sync from your Duck Stats account; no manual upkeep. Pro tier and up.
Dedicated WHMCS page → See pricing →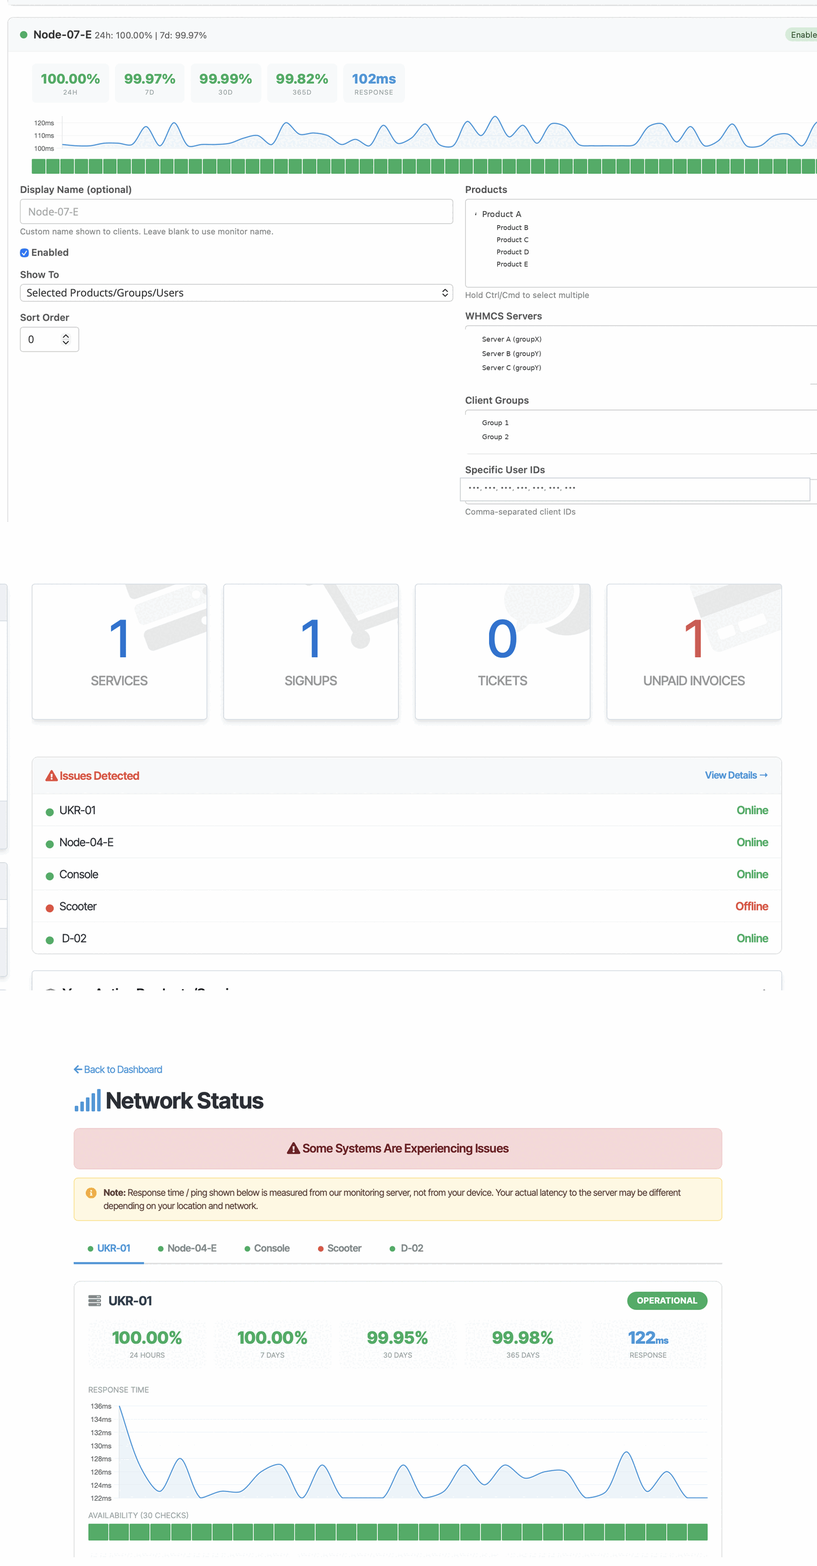
Uptime tells you the site was reachable. Analytics tells you whether anyone came, where from, and what they did. Both on one bill, one login — no second vendor, no second invoice.
Paste one line before </head> and you're collecting. Single-page apps are handled automatically — React and Vue route changes count as pageviews without extra wiring.
No cookies, no local storage, no fingerprinting. Visitors are counted with a salted hash that rotates every day and is never stored in reversible form, so there is nothing to ask consent for.
Pageviews, unique visitors, sessions, bounce rate and time on page — plus top pages, entry pages, referrers, campaigns, countries, browsers and devices.
Fire duck('signup') from any button and turn it into a tracked conversion. Attach a value and the dashboard reports revenue per campaign.
Campaign links are attributed to the campaign, not to whichever site linked them last. Tracking parameters are stripped from page paths so your top-pages report stays readable.
Publish a read-only dashboard link for a client or a colleague. Revoke it whenever you like — re-sharing mints a fresh URL rather than reviving the old one.
Honest about the limits: visitors running ad blockers are not counted, so expect to under-report by roughly 10–25%. That is true of every analytics product, including Google Analytics — anyone claiming otherwise is guessing.
Drop an invisible 1×1 pixel into any HTML email — sent from Gmail, Outlook, WHMCS, a PHP script, a Django job, anything — and Duck Stats records who opened it, when, and on what. It does not have to be an email Duck Stats sent.
Every recipient gets their own token, so on a message to five people you see which ones opened it — not just a total. You can also track at domain granularity, when “someone at acme.com opened it” is the answer you actually need.
Timestamp, IP address, country, mail client, operating system, device type and which open this was — first, second, tenth. The full history sits on the message in your dashboard.
Apple Mail Privacy Protection prefetches images at delivery time and Gmail fetches through GoogleImageProxy — with no human involved. Most trackers count those as opens and hand you an inflated number. Duck Stats records every hit but labels it — human, Apple MPP, Google proxy, scanner or bot — and reports a separate human opens count that means what people think “opens” means.
Sending as acme.io and acme-support.com is still one sender. Attach domain aliases to a tracking code and every one of those domains reports into a single history, instead of fragmenting into a separate code per domain.
Opt in to an email the moment a tracked message is opened, carrying the whole record — recipient, code, time, IP, location, client, device, open number and classification. Pick first human open, every human open, or every hit; a cooldown keeps Apple's prefetches from spamming your inbox.
Opened — a human loaded the pixel. Delivered — only proxy prefetches were seen, which proves the message arrived but not that anyone read it. Unknown — no pixel hits at all. There is deliberately no “not delivered” state: a pixel cannot detect a delivery failure, and we won't pretend otherwise.
| Recipient | Opens | Last seen | Where | Client |
|---|---|---|---|---|
| [email protected] | 3× human | 14:22 | 🇨🇦 Canada | Gmail · macOS |
| [email protected] | 1× human | 09:07 | 🇺🇸 United States | Apple Mail · iPhone |
| [email protected] | — Apple MPP | 08:51 | 🇺🇸 United States | Prefetch, no human |
Illustration — sample data, not a live account.
What you embed. One <img> tag pointing at a 43‑byte transparent GIF, carrying a token unique to that recipient. Either paste it into your signature or template yourself, or call POST /api/inject and let Duck Stats rewrite the HTML for you before you send. No SDK, no SMTP change, no DNS record — and the mail keeps going out through whatever you already use.
Why “opens” is a lie everywhere else. Since 2021, Apple Mail Privacy Protection loads every image the moment mail arrives, from an Apple relay, whether or not the person looks at it. Gmail fetches images once through GoogleImageProxy and caches them — so a second read may record nothing at all. Corporate security scanners open every link and image in the message before the recipient sees it. Every one of those is a pixel hit with no human behind it. Duck Stats stores them all, tags each one as human, Apple MPP, Google proxy, scanner or bot, and reports human opens as a separate figure. The number you see is the number of people.
The three states, and the fourth we refuse to invent. Opened means a human loaded the pixel. Delivered means only machine prefetches were seen — the message arrived, but nobody has read it. Unknown means no hits at all. There is deliberately no “not delivered”: a pixel that never loads proves nothing. Images may be off, the client may be text‑only, or the mail may just be unread. Only SMTP bounce data can prove a failure, and no tracking pixel has it.
Several domains, one history. If you send as acme.io and acme-support.com, you are still one sender. Attach both as domain aliases on a single tracking code and they report into one timeline instead of splitting into a code per domain.
What is recorded per hit. Timestamp, IP address, country, mail client, operating system, device type, and which open this was. Country comes free from the edge; city‑level location is not available today and we would rather say so than round it up to a guess. Raw IP and user‑agent rows age out after 90 days — the per‑recipient counts and first/last open times are kept, so your history survives the cleanup.
Be straight with people. Open tracking records data about your recipients. In the EU and UK that generally needs a lawful basis under GDPR, and some jurisdictions require consent. Say so in your privacy policy. Plain‑text email cannot be tracked at all, because there is no image to load.
Add your first monitor free. It takes about two minutes and zero installs.
Start monitoring free